Search engine saturation: The ever evolving SERP and how brands are responding
The marketing world has had massive changes and search engine saturation has hit the lowest level in 11 years. What does it mean for brands and ecommerce businesses?
- The evolution of search results in addition to this crazy pandemic has changed search results more than ever. Including new features to drill down by brand, see news, and reviews.
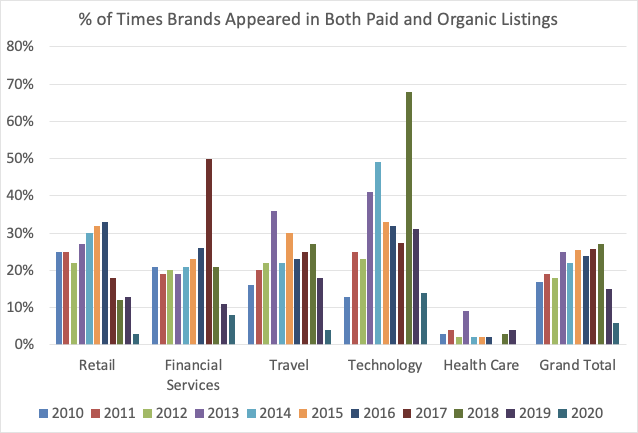
- Brands who appear in both paid and organic listings were at the lowest level in 11 years with just 8% of brands appearing in both categories.
- Google local map pack results are appearing in 47% of search results. The highest since this study has been conducted in four years.
Yes, we know, this year is unlike any other. The world is always changing around us, but this year the pace of change is faster and more jarring than ever. The search engine marketing world has had massive changes. This made my annual look at search engine results very interesting. Starting back in 2010 I started trying to understand how brands handled bidding on paid search when they were also in organic search. Recently, this has also included how often the local map pack + shopping results were included. At a macro level, this year caused massive changes – for example, travel is basically shut down, curbside is now a word that not only we are all familiar with but expect brands to deliver, and ecommerce has experienced explosive growth.
Search engine saturation at the lowest level in 11 years
So how did these macro changes impact the number of brands who appeared in both paid and organic search? Simply put it crashed. Overall, it was down by 60% year over year and 78% from 2018. This was mostly driven by a reduction in paid search results overall. Travel alone was down 78% since 2019. Travel down is very logical and makes sense given the reduction in both consumer and business travel. Travel brands are choosing to not make the investment in paid traffic at this point given the low likelihood of conversion.

What is surprising was the reduction in the retail overlap. Retail volume hasn’t been reduced, instead, it’s simply shifted to a more digitally forward DTC model. Retail search overlap is down 77% year over year to just 3%. That means that just 3% of the page one listings had the same brand in both organic listings and either Paid Search or Shopping listings. This stat is really incredible. We had retail peaking at 33% of brands having listings in both areas just a few years ago. So why the decrease? I think you can directly attribute this to two key factors:
1. The rise of DTC brands
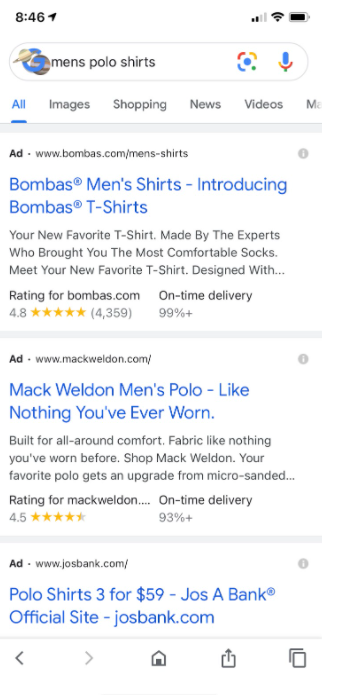
This year has seen the massive growth of brands that are direct to consumers. Take a look at the screenshot below. The search results seen without scrolling are all ads and the top two are DTC brands (Bombas and Mack Weldon). These brands increase the number of competitors to “traditional brands” who would have traditionally competed for these listings. This makes it more difficult to have your listing in both paid and organic search.
2. Google Shopping moving from paid to free
This democratizes smaller brands’ ability to appear in shopping results. The move from paid to free has not only removed any financial barrier allowing more brands to enter. It also lets those brands who were only submitting just portions of their product feed to submitting the entire feed.

Shopping and local map listings appear on 40% of search results
Long gone are the days of 10 blue links. Now search results are filled with an assortment of various results from the local map pack, shopping results, news, images, “brand refinement,” and reviews to name a few. These results complicate things for brands. Understanding how all these pieces fit together and impact the customer journey and customer experience isn’t easy.
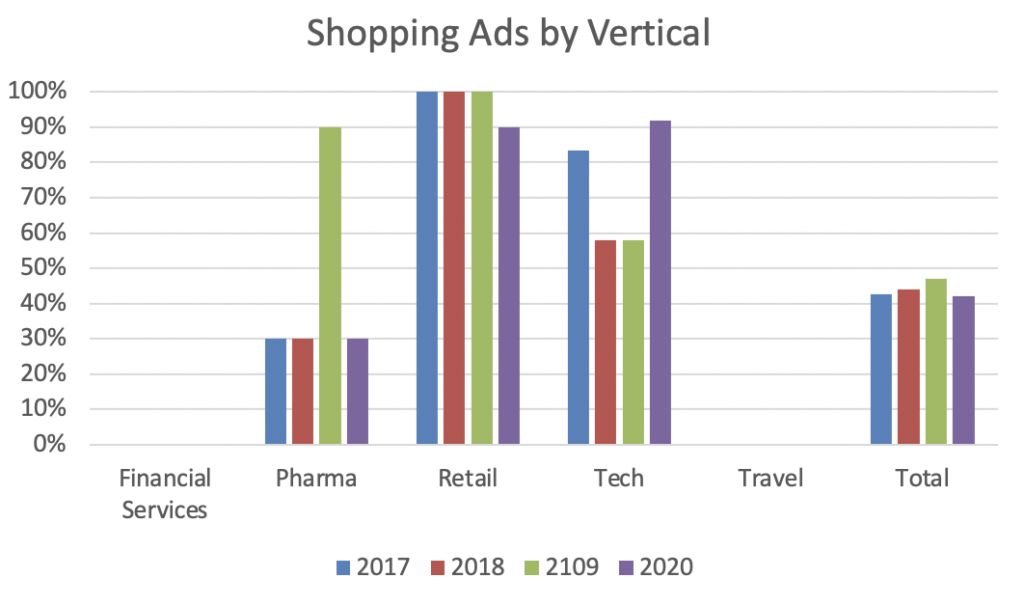
For the purposes of this article let’s just focus on how often these various types of listings appear. Starting with Shopping listings. The frequency of times a shopping listing is included in a search result has been fairly consistent at around 40%. One theory would be change from paid to free listings would decrease the number of shopping ads Google would show to maximize revenue. However, this isn’t the case. Instead, the results are consistent with Google’s overall strategy to continue to provide consumer choice and fight against Amazon as the first source for retail searches.

It’s a different story for the local map pack. This has continued to grow year on year. This year it was the highest since I started tracking this 4 years ago at 47%. This finding was fascinating given the economic environment we are in. However, Google continues to want to provide choices to consumers and support local businesses. There have been a lot of updates to the Google My Business product over the past few years and those investments are showing up by being included in more search results.
search results.
Search engine saturation - Stats on industries
Maximize your SERP for your customers
There are three things we recommend our clients think about when trying to determine how to best optimize their search engine strategy.
1. Understand the customer experience
You should always walk through the experience that your customers would be having. Understand what they might be seeing and experiencing. Are landing pages and ad copy aligned? Is another brand providing a better-optimized schema that provides direct answers for a key consumer query? You need to understand what they are experiencing to be able to create a strong search engine marketing strategy.
2. Understand your KPIs
Not everyone can afford $60 for a car insurance paid search click. Understanding what you can afford and what your key business drivers are is key. Your strategy and ability to be aggressive might be different for different targets, keywords, etc… This is a great place to understand your various customers, some are more valuable than others and can impact your bid modifiers. You can’t manage what you can’t measure. This is the key to this important pillar.
3. Always be testing
As you can see from these results things have changed a lot over the years and will continue to do so. Personalization will continue to drive these results based on the specific individual making it even harder to understand what’s driving impact. The key is to accept change and build a plan that enables testing and optimization. This will help keep your continue fresh on your site, the big strategy agile, and your technical architecture held accountable for SEO results. These elements will help you stay ahead of the competition who might be distracted by other elements or relying on previous success.
Thanks for Scrolling


0 Comments